Profiling osbuild-composer with Go pprof
One of the projects that I work on is osbuild-composer . This is an operating system image builder, written in Go, and is the replacement for the lorax-composer project. I’m going to skim over the details since this post is about profiling things, but you can read more about it at osbuild.org and the [GitHub repository].
Behind the scenes it uses DNF
to
handle depsolving and package queries. A few weeks back I wrote a patch
to cache the results from the dnf-json program in order to speed up the response time when
listing all the packages (over 63000 of them in Fedora 35!) and when searching
for details of package lists. Cache entries expire after 60s so that there is
minimal chance of the data being out of sync with the DNF repository metadata.
One of the questions that came up was ‘how much memory does this cache use?’ and whether it needed some way, other than the 60s expiration time I implemented, to remove old entries. So I decided to gather some data and see how much RAM was actually being used.
Go has support for profiling via the runtime/pprof
module.
You can profile your program using go test or via calls to pprof helper functions. This is fine
for a short running cmdline program, but for a service like osbuild-composer you need to
run it for a while, make multiple queries, and examine the
results. Go has a http module that exposes the pprof data on a socket.
Documentation is in the net/http/pprof
module.
Adding support to osbuild-composer was simple
. Import the module and launch the server on port 6060. After rebuilding
osbuild-composer with make scratch, I installed the new rpms in the test VM and
accessed the pprof data from the cmdline like this:
pprof http://localhost:6060/debug/pprof/heap
If you want to use a browser instead of the interactive cmdline mode you can run this:
pprof -http=:8080 http://localhost:6060/debug/pprof/heap
And a server will be launched on port 8080. You can now use your browser to
view the details of the heap data. Note that this is a snapshot in time that is
made when you run pprof. To refresh it you exit (Ctrl-C) and run it again. Now
we can explore the memory usage of various parts of the running service. I have
a script that uses echo 3 > /proc/sys/vm/drop_caches to drop the kernel
caches in order to try and get more consistent results inbetween calls to the
API. The script looks like this:
#!/usr/bin/bash
function run_curl() {
        echo 3 > /proc/sys/vm/drop_caches
        echo "time for $1"
        time curl --silent --unix-socket /var/run/weldr/api.socket http://localhost/$1 > /tmp/debug.log
        echo
}

run_curl 'api/v0/modules/list/**'
run_curl 'api/v0/modules/list/'
run_curl 'api/v0/projects/list/'
run_curl 'api/v0/projects/info/0ad,0ad-data,0xFFFF,2048-cli,2048-cli-nocurses,2048-cli-sdl,2ping,389-ds-base,389-ds-base-devel,389-ds-base-libs,389-ds-base-snmp,3Depict,3dprinter-udev-rules,3mux,3proxy,4Pane,4diac-forte,4th,4th-devel,4ti2,4ti2-devel,4ti2-libs,5minute,64tass,7kaa,7kaa-data,90-Second-Portraits,9pfs,9wm,AGReader,AcetoneISO,Add64,Agda,Agda-common,Agda-stdlib,Agda-stdlib-docs,AllegroOGG,AllegroOGG-devel,ArpON,AtomicParsley,AusweisApp2,AusweisApp2-data,AusweisApp2-doc,BackupPC,BackupPC-XS,BareBonesBrowserLaunch,BareBonesBrowserLaunch-javadoc,BibTool,BitchX,BlockOutII'
run_curl 'api/v0/modules/list/golang-*'
run_curl 'api/v0/modules/list/*goat*'
After running this I launched a pprof http server and use the `top’ view to examine memory allocation:
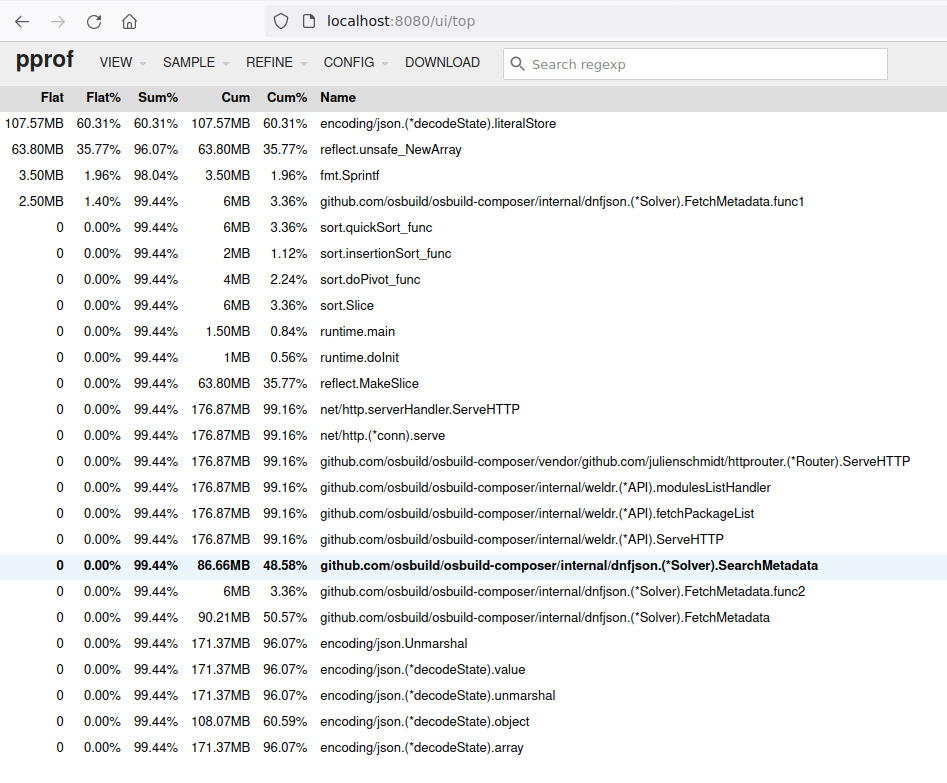
The allocation data is related to the functions that allocate the data - there
is no way that I know of to look at a specific memory structure. The important
functions in this case are SearchMetadata and FetchMetadata. They add
dnf-json results to the resultCache which is part of
BaseSolver
.
We can see that it is using 86.66MB, and you can then make more requests and
rerun pprof to see how large this number grows.
If you have graphviz installed pprof can also generate the call graph, select
the ‘Graph’ option below the ‘VIEW’ dropdown in the browser and you will see
something similar to this:

I also wrote a script to query the info on all available packages in parallel.
But it ends up that dnf-json limits how many requests can be processed. The
conclusion that I came to was that dnf-json is locking access to the
metadata, essentially serializing parallel runs of dnf-json so the cache in
osbuild-composer cannot grow large due to the slow response time of dnf-json
combined with the 60s expiration time. So there is no need to add extra
complexity to try and limit memory use of the cache.
In addition to using pprof I added a /debug route to the API to extract
real-time estimate of the
usage
.
This is based on a technique described in a Stack Overflow
post
that uses the gob module to
encode the map as a byte stream. It has some overhead, but gives a general idea
of how much space is being used.
For example, after running the above script the output looks like this:
curl --unix-socket /var/run/weldr/api.socket http://localhost/api/debug
{"entries":"5","size":"108003831","timeout":"60000000000"}
Which is fairly close to what I am seeing with pprof.
runtime/pprof can do much more than what I have described here, see the Go documentation for more details. And here are a couple of other blog posts on profiling Go: one , two .