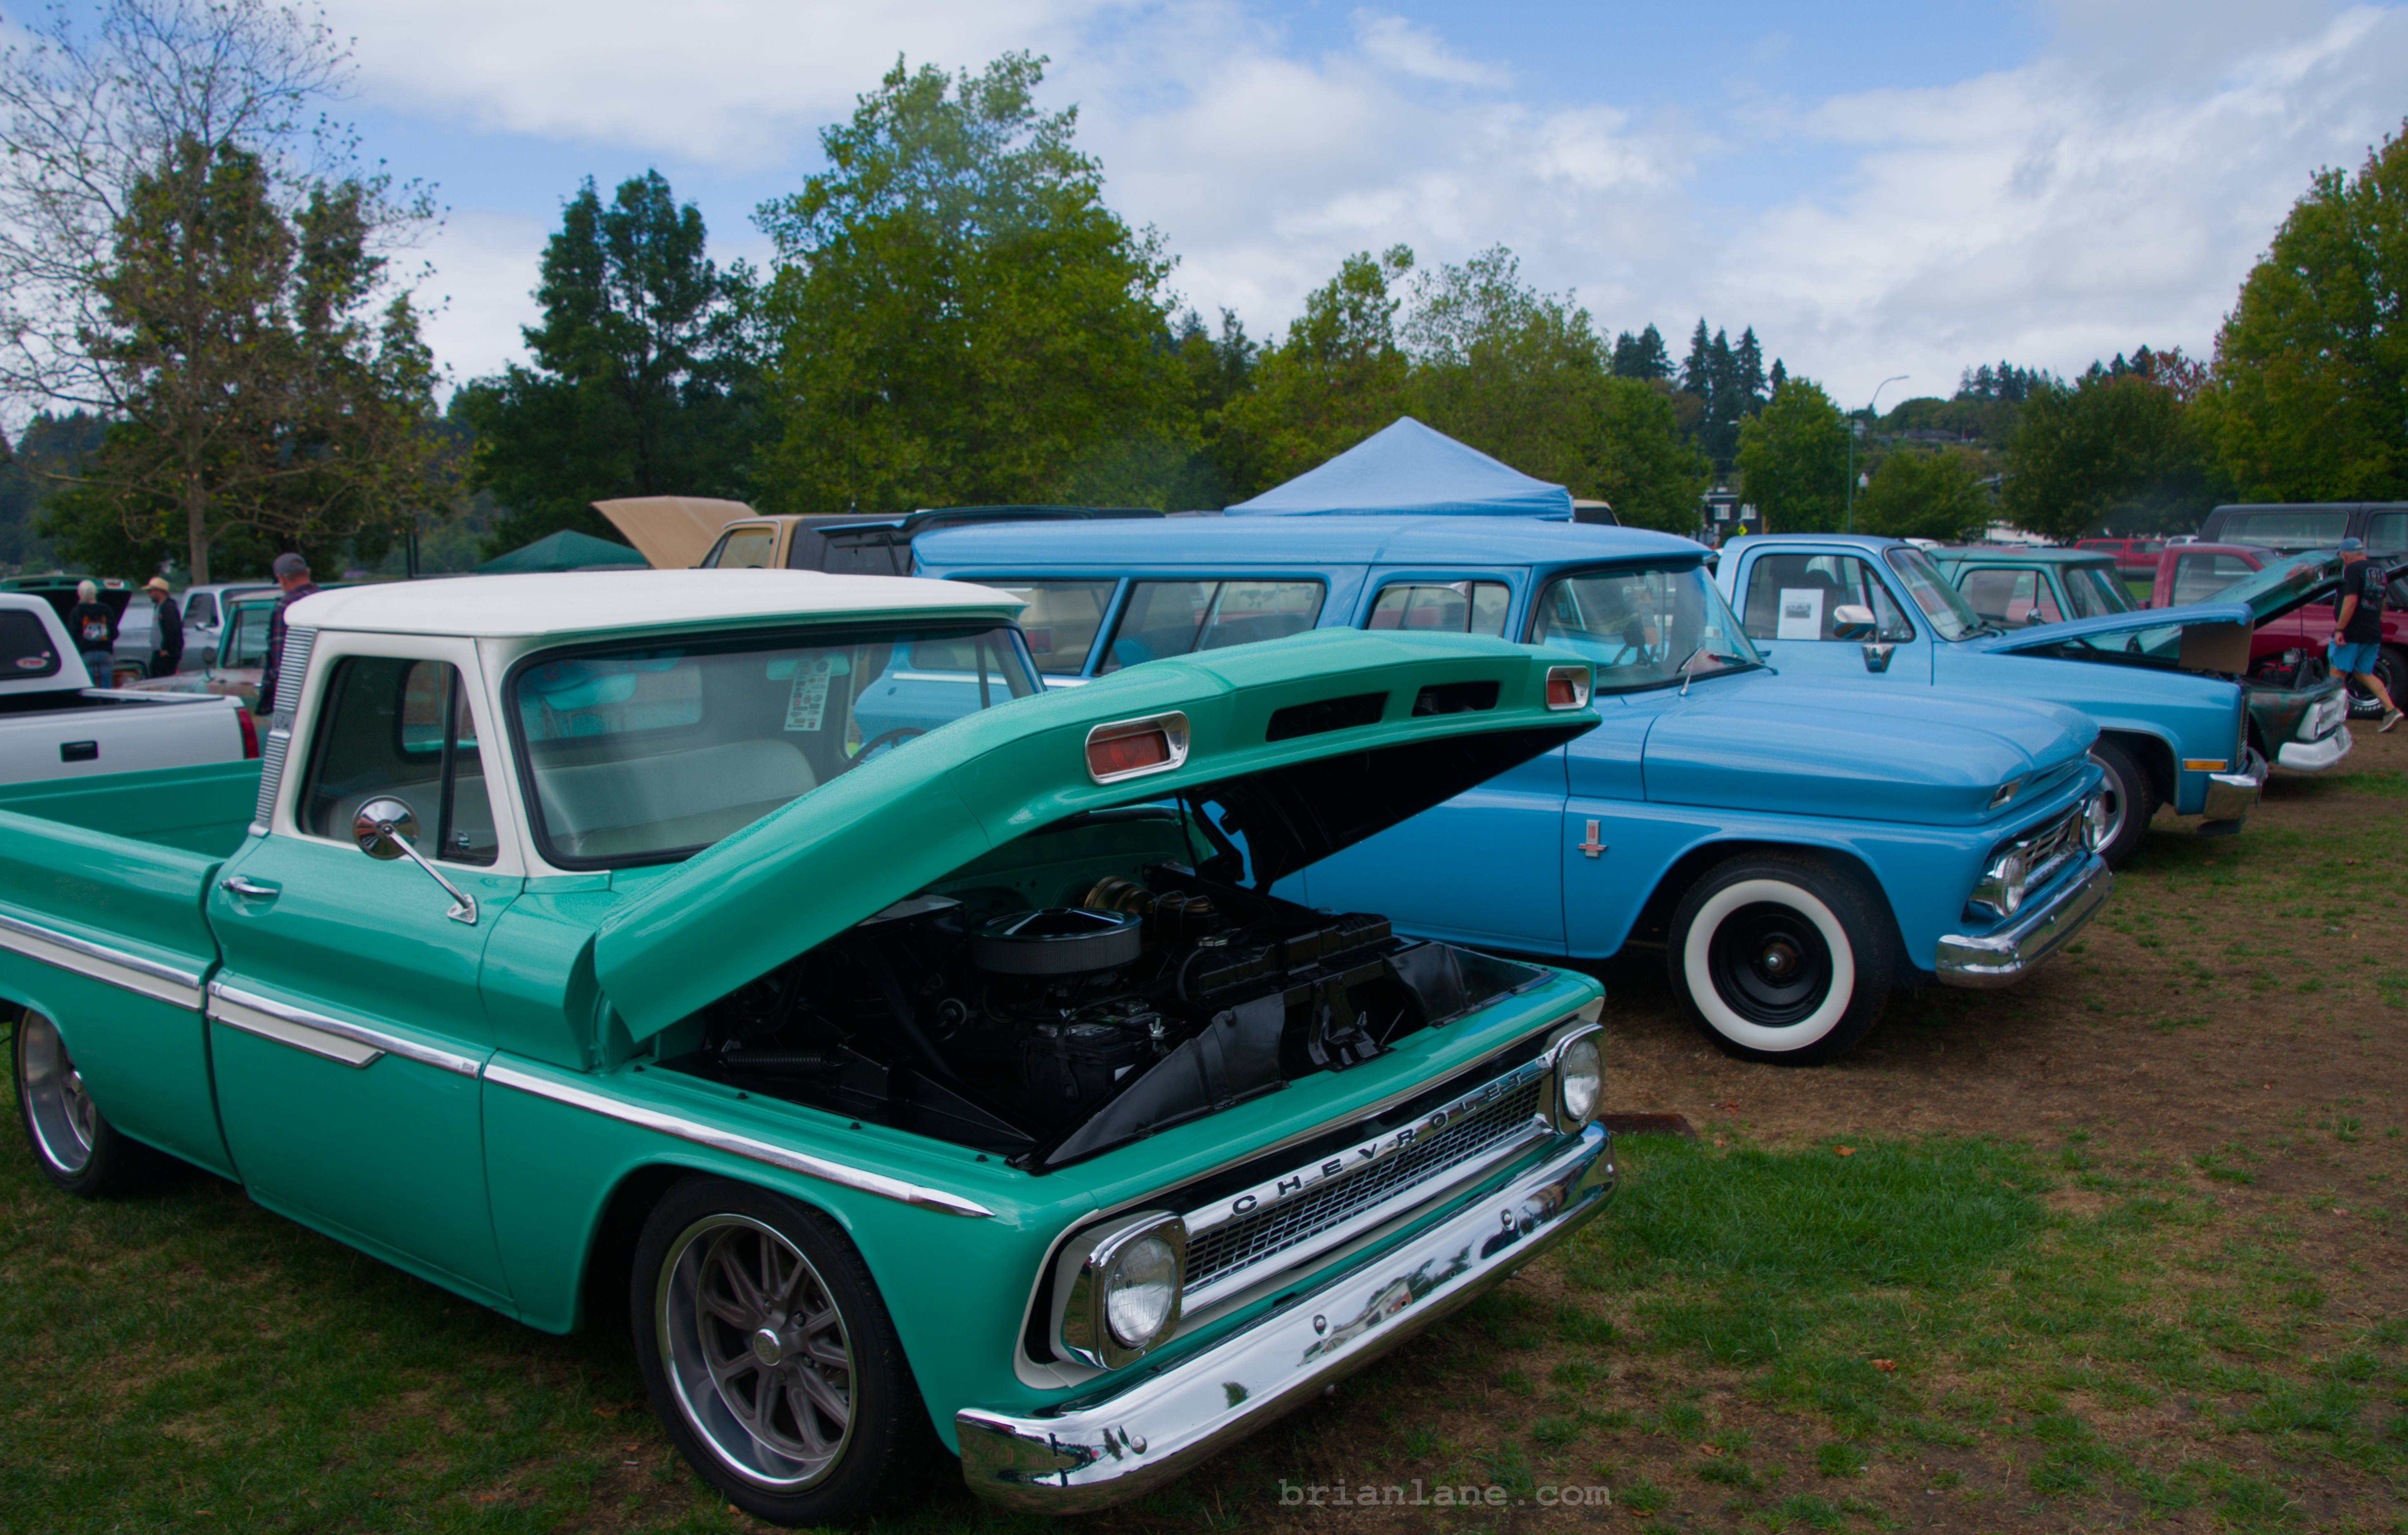
C10s On The Capital
Some of the trucks at the 2025 C10s On The Capital show. Turnout was a bit lower than past years, it was a bit drizzly with sun breaks.

Some of the trucks at the 2025 C10s On The Capital show. Turnout was a bit lower than past years, it was a bit drizzly with sun breaks.
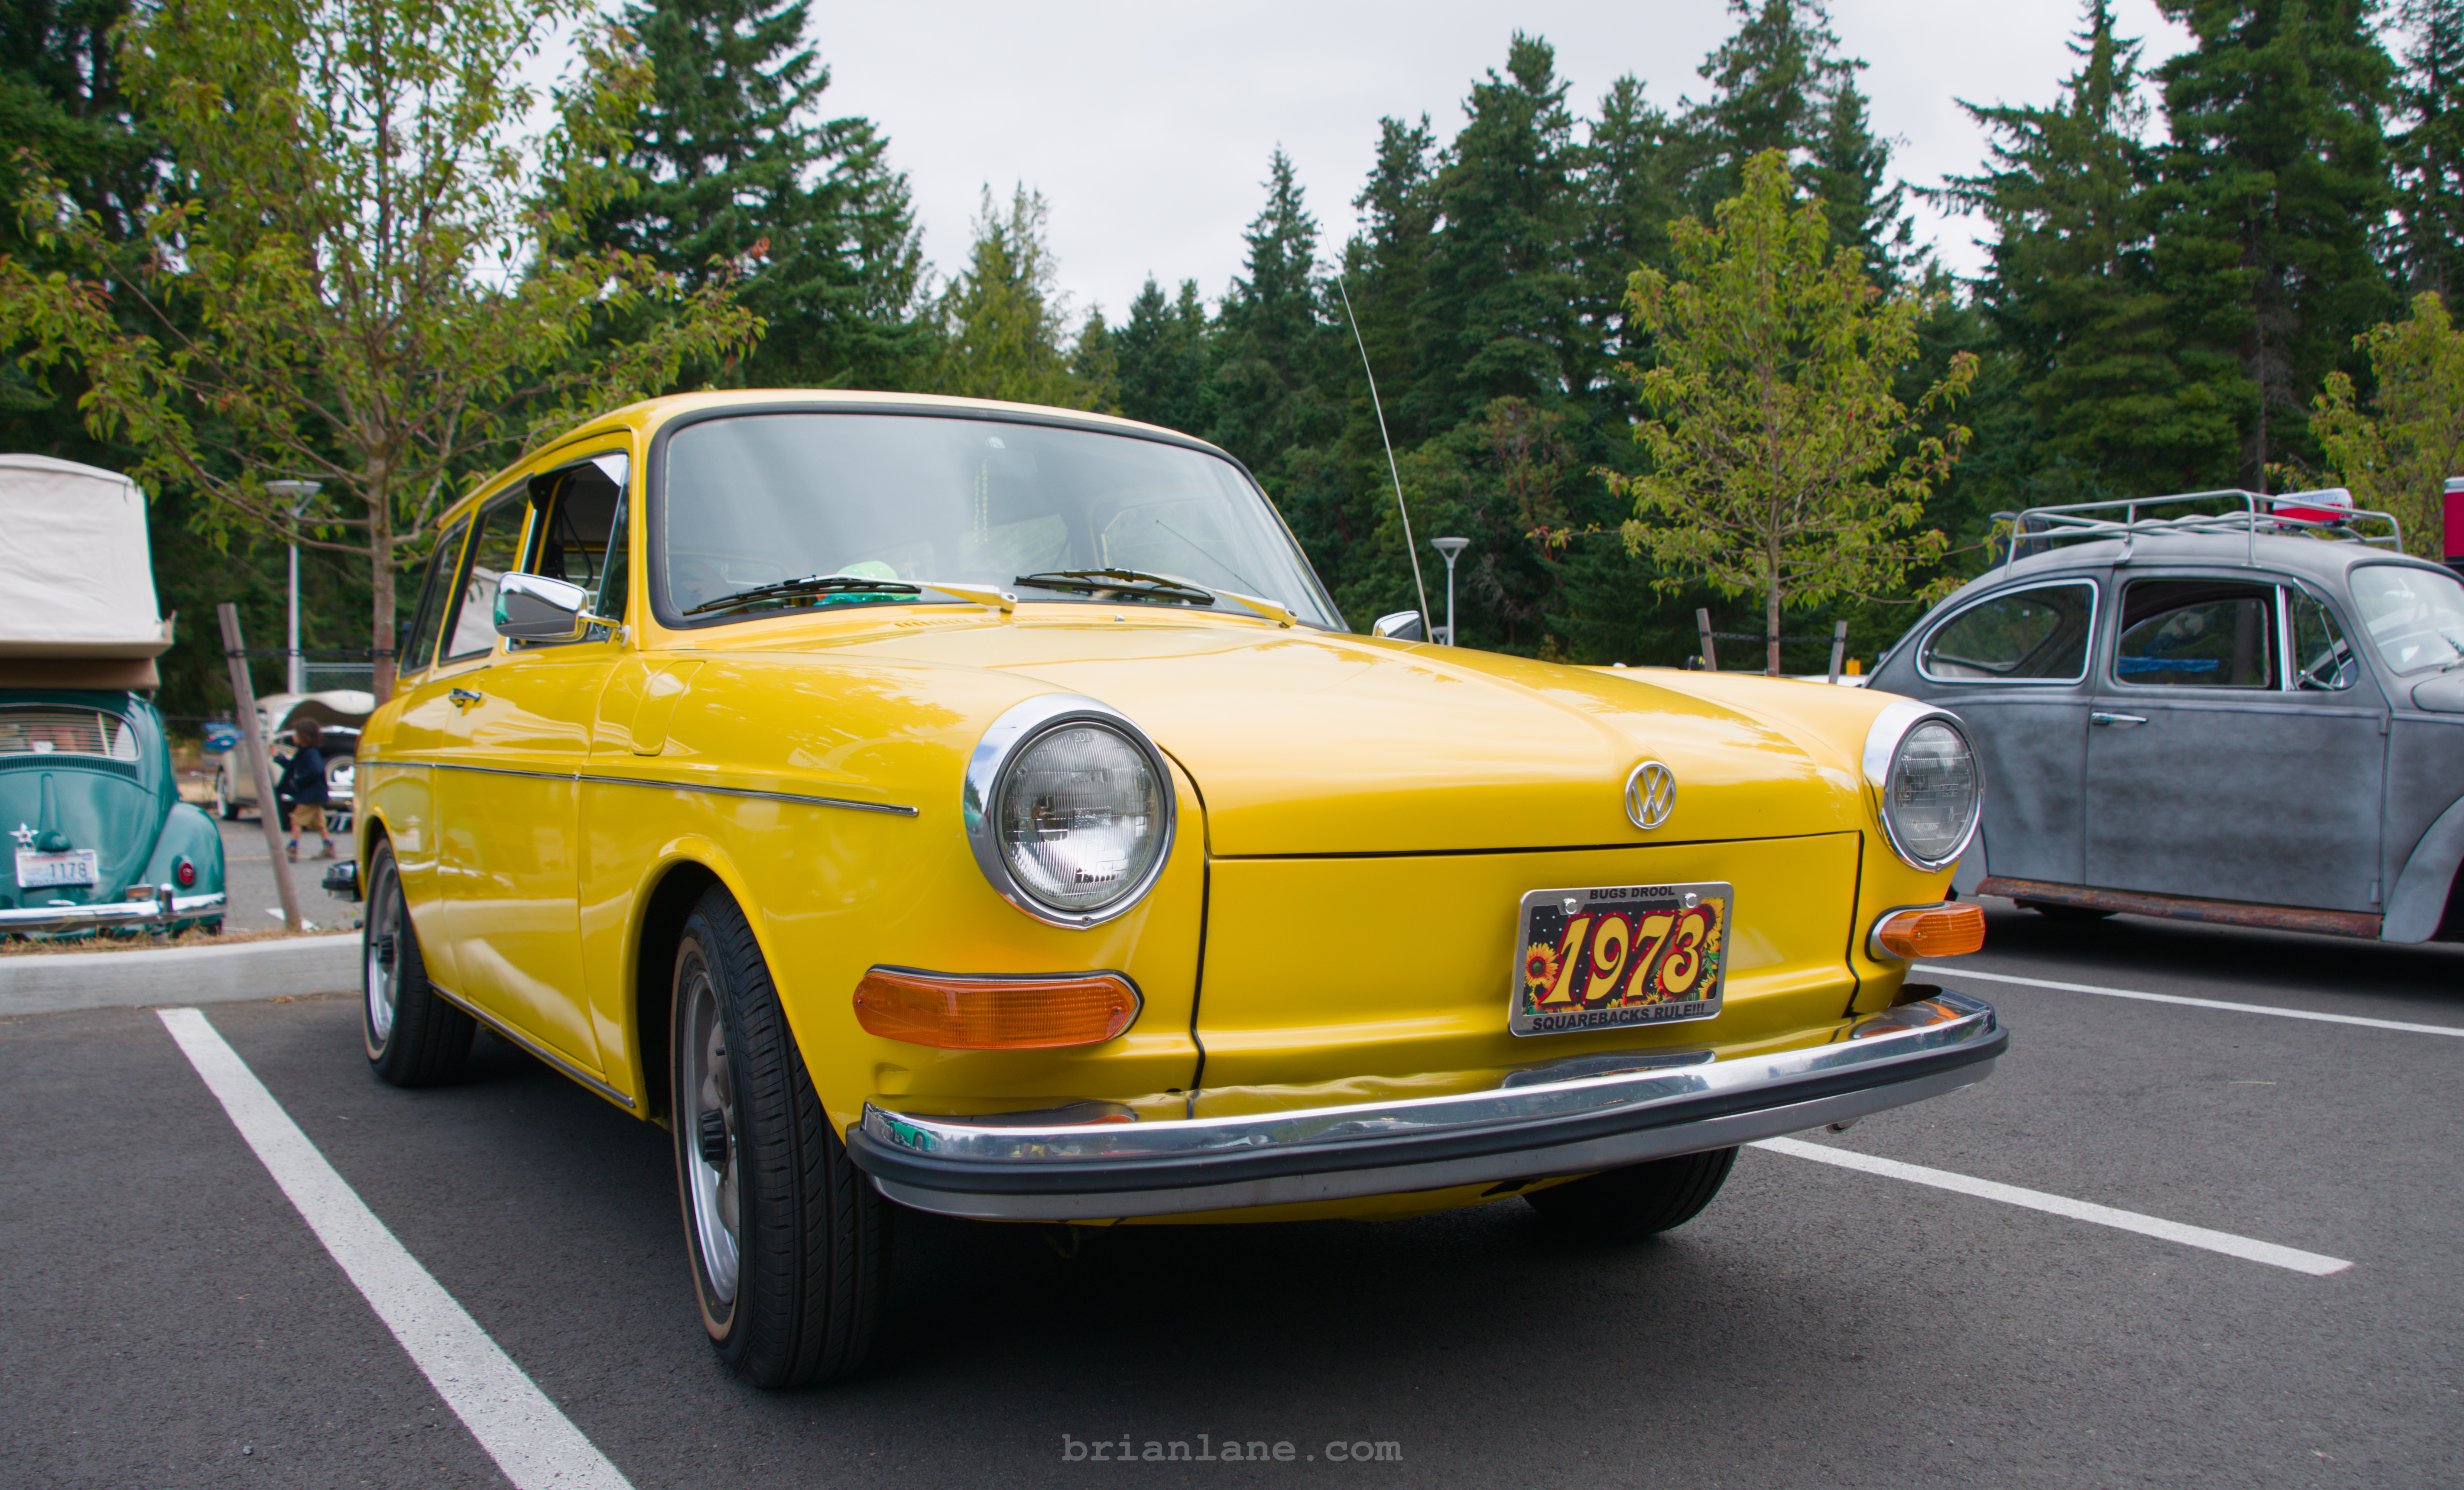
Photos from the 42nd annual NW Vintage VW Meet (2025)

Went to the Kluh Jewelers car show yesterday and got these shots.
I’ve mostly automated the setup of the software for the Life display frame software. You can find the scripts here on GitHub . Running this requires a Linux system with ansible and git installed.
I am running this on a Raspberry Pi ZeroW , but it should work on just about anything running Debian Linux .
This uses the lite version of Raspberry Pi OS without a GUI. You should download the correct one for your hardware, expand the image, and write it to an SD Card:
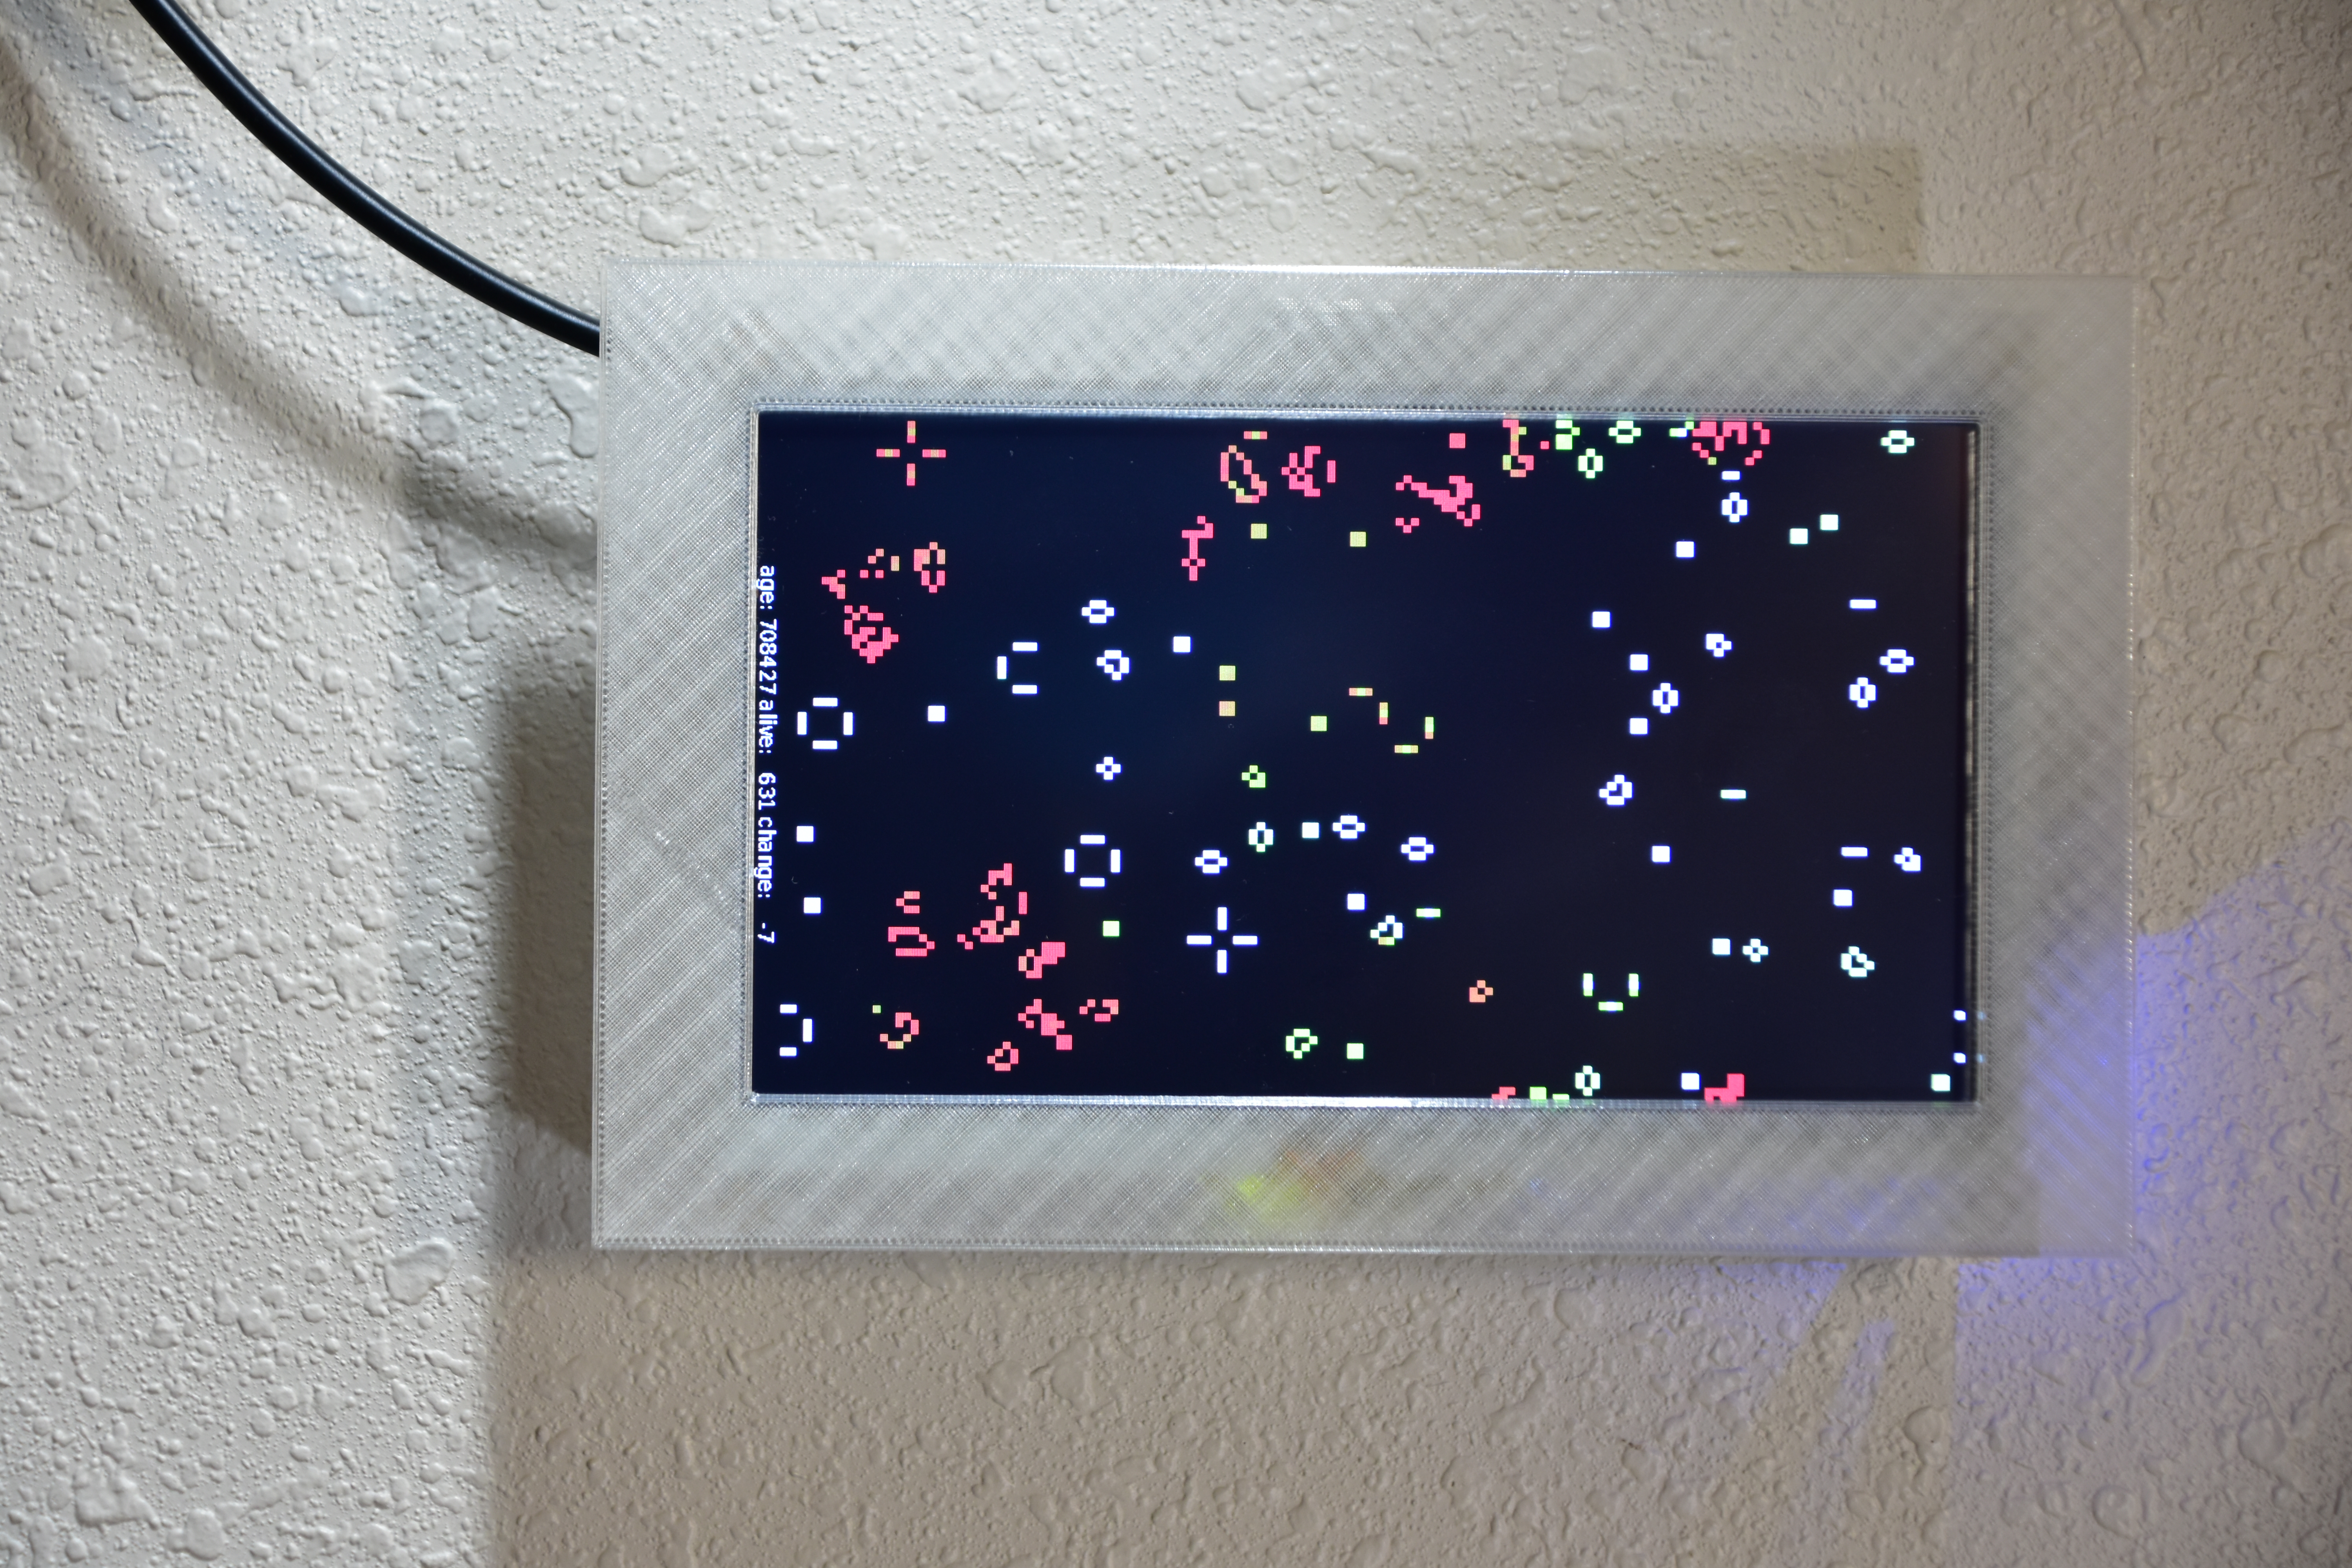
Last year I wrote about my sdl2-life program, adding color to it, and seeding it with data from my website logs. This time I’ve decided to make a dedicated wall display for it using an Adafruit touchscreen display and a Raspberry Pi Zero that I bought back before they became unobtainable.
After a bunch of experiments with the design I managed to make a display that won’t fall off the wall and it looks reasonably nice. The OpenSCAD and STL files can be found here .

I made it to the Olymic Air Show today. Good turnout, decent weather, and some very cool airplanes and helicopters.
This is a followup to the qemu with PXE boot
post I wrote a few years back. In this post I will cover the creation of a
live filesystem using livemedia-creator, and PXE booting it with qemu and UEFI.
I am assuming that you have some familiarity with using
Anaconda
to install Fedora, CentOS,
and Red Hat Enterprise Linux. As well as with my previous posts about
livemedia-creator
.
The creation process is similar to creating live isos but instead of an iso we will create the live root filesystem. This is an ext4 filesystem that is compressed using squashfs, and it is the same as the rootfs used on the boot.iso and live isos.
DigiTemp is a simple to use program for reading values from 1-wire devices. Its main use is for reading temperature sensors, but it also reads counters, and understands the 1-wire hubs with devices on different branches of the network.
See the digitemp.com page for more information.
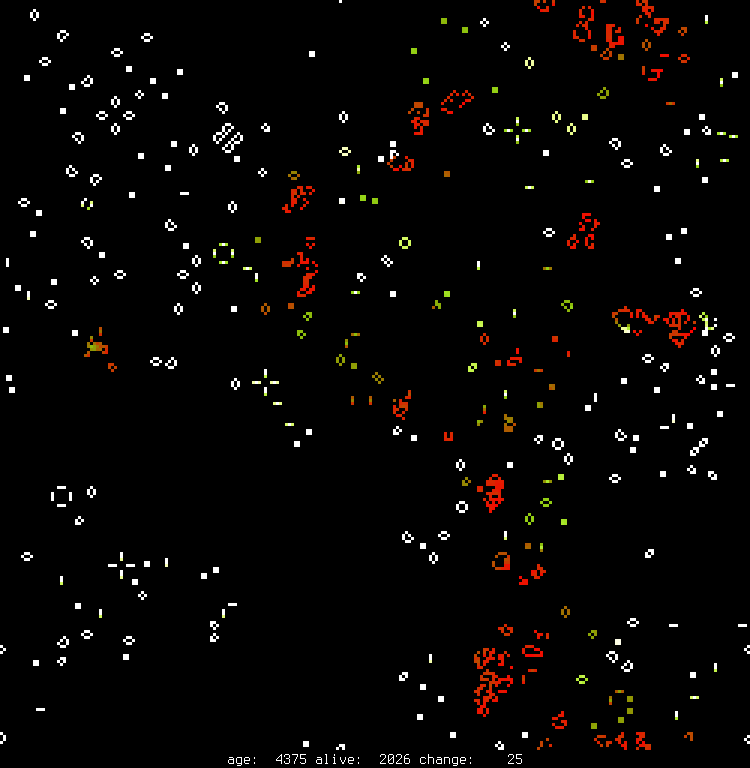
After letting the life server I wrote about last month run for a bit I decided that all white cells are a bit boring and I started exploring ways to add some color to it. First step was to keep track of the age of the cells, and I decided that new cells should inherit the age of the cells that created it in the hope that it would be more visually snazzy. I started with the color code from the wasm mazes project .
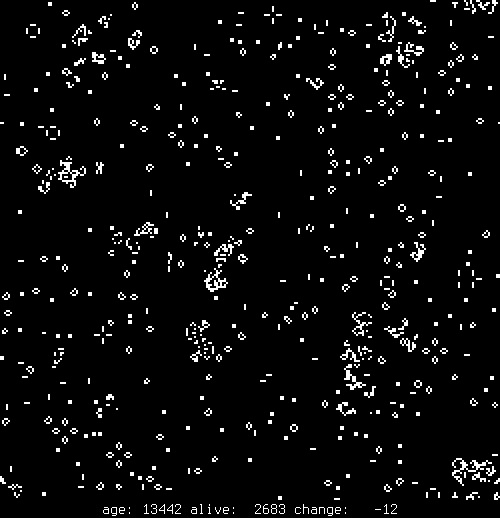
A few years back I was experimenting with Go and SDL2, I wrote a dead-simple Conway's Game of Life program with it, added loading of a couple popular pattern file formats, and was pretty much finished with it. The other day I came across this cool project while preparing for Thanksgiving by browsing infosec.exchange . Brett has an e-ink display running life and is seeding it from tarpit data which struck me as a really neat idea to keep the world from becoming static as most of the more complex ones tend to do.